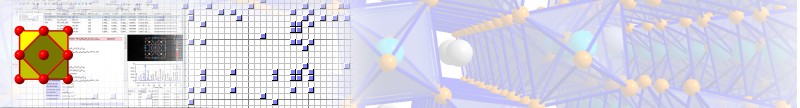
Pearson's Crystal Data Features: Pictures of an entry each
Features overview
Previous: Configure the entry data sheet
Next: Phases list
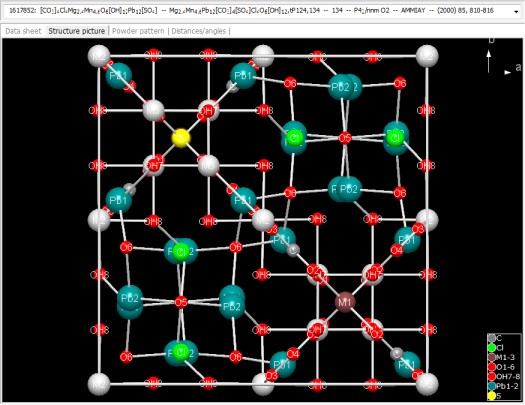
A complete crystal structure visualization tool is integrated into the Pearson's
Crystal Data software that allows the user to create a 3D structure picture of the
unit cell with bonds (default setting). There are several settings available to
change the size of the cell range as well as for model (default ball-and-stick,
or wires or space-filling) as for the viewing direction.
You can rotate the structure with the mouse or change the enlargement factor or
measure distances or angles by clicking two or three atoms in the structure picture
each.
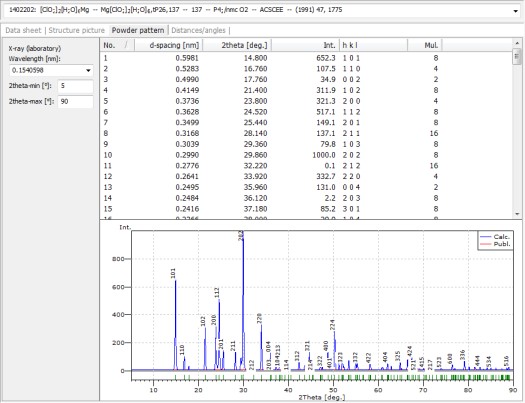
Calculated and/or published powder diffraction data are displayed on the "Powder
pattern" tab sheet of the entry data view. If both calculated and published data
are available, you can either display one of them or both at the same time:
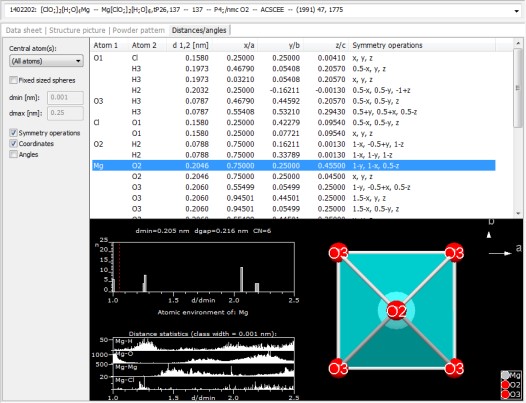
On the "Distances/angles" tab sheet you get a list of distances, optionally with
angles. For the atom that is currently selected in the list, a structure picture
of its coordination sphere as well as corresponding distance histograms are displayed
in the lower part.
By default the distance range depends on the atomic environment that is stored with
the atom site each in the database. Alternatively you can define a fixed range in
nanometers.
Features overview
Previous: Configure the entry data sheet
Next: Phases list
|