Pearson's Crystal Data Features: Figure plots
Features overview
Previous: Dynamic plots
Next: Configure the entry report
For some entries, pre-defined plots (so-called "figure plots" or "static plots") are available.
These plots have been prepared by the editors of Pearson's Crystal Data and display e.g.
a certain unit cell parameter as a function of temperature for a certain prototype. These
plots cannot be modified by the user (in constrast to the Dynamic plots), so
they are called "static plots" or "figure plots".
If one or more figure plots are available for a certain entry, this is indicated by a corresponding link
figure plot available in the Figures subsection of the Remarks section in an entrys data sheet:
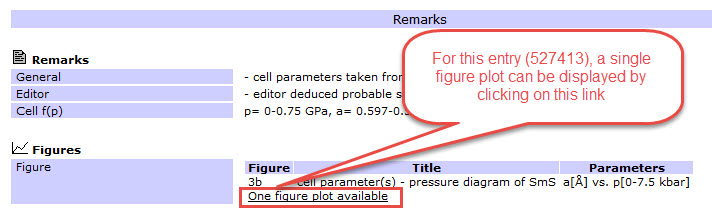
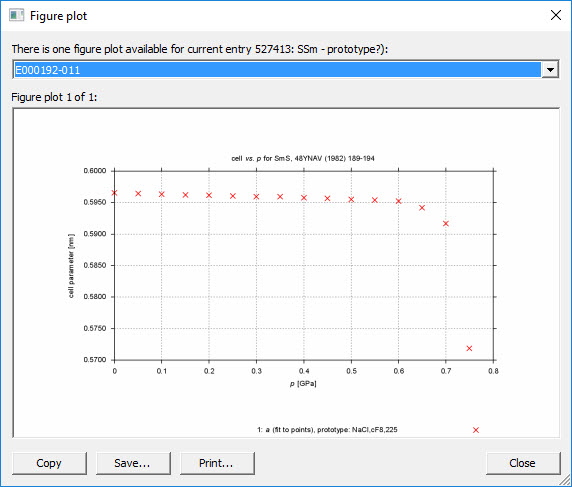
If you click on one of these links, one or more figure plots will be displayed in a new dialog window
(see figure below). The plot to be displayed is selected at the top of this window (in case there is more than a
single plot available). You can copy, save or print the plot by clicking on the corresponding buttons
at the bottom of the window.
Features overview
Previous: Dynamic plots
Next: Configure the entry report
|